and the congressional districts it affected.
Summer and Fall wildfires in California are a yearly occurrence, as temperature rises and precipitation falls. Dead vegetation provides plenty of fuel for a fire (all of us have seen the rolling hills covered in dry, brown grass). In 2009, however, several years of drought added to these normal factors created a “perfect storm” of fire conditions. I remember hearing about fire after fire raging throughout California, and was seriously concerned not only about the physical damage caused by the fires, but the air pollution created by so many fires. Fortunately it didn’t reach the same level as the fires in Russia, this summer, where the deadly heat combined with the poisonous smog from the fires that the people were forced to breathe in, were causing 700 deaths a day in Moscow (Wikipedia).
Nevertheless, during the summer of 2009, a total of 63 fires raged throughout California, destroying thousands of acres, and killing two people (McIntire 2010). It is kind of crazy how skewed our sense of disaster is, compared to other less fortunate countries. For example, it is a big deal that two people died in the fires in California, even though in Russia, 15,000 people have died so far (Wikipedia). The largest and most destructive of these fires was the Station Fire in LA County, about which we did this week’s lab.
The fire, which burned from August 26th to October 16th, burned over 160,000 acres, and destroyed hundreds of structures, including 90 homes (Inciweb 2009). It threatened several communities, parks, and important buildings, and killed two fire fighters. After investigations, it was determined that the fire was started by arson. To date it is the biggest fire ever recorded in LA county, and the 10th biggest overall in California.
In my map, I have overlaid the referential layers of the Station Fire (county boundaries and a DEM), with the thematic portion, congressional district lines. I chose to show the congressional districts that were affected by the fire (four in total), because often times disasters (man-made or natural), play very big parts in determining the success or failure of the politicians involved. Their approval ratings will go up if the public sees that they do a good job of responding to the disaster, and will go down if they are slow to take action, or aren’t properly sympathetic, etc. For example, there was a lot of public outcry and resentment towards Bush for his response to Katrina (Roberts 2005), and same with Obama for the Gulf oil spills. What party a politician belongs too also plays a large part in what his response will be, and how the public views them (for example, if a politician has been campaigning on a pro-nuclear energy platform, and then there is a power-plant failure, then it’s pretty much over for them).
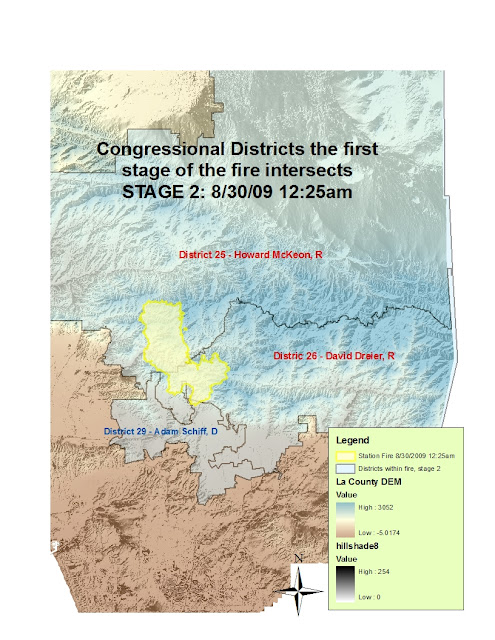
As you can see in the maps, I chose five stages of the Station fire (five different times and days), and created a separate layer for each of them to show which district they were affecting. The fire started out burning in only two congressmen’s districts, but then spread to a third, and finally a fourth. Two democrats, and two republicans (Cabanela). However, despite it being interesting to see the spread, I don’t actually think that the fire affected those politicians careers too badly. For one thing, the fire problem was clearly a statewide issue, and not limited to LA county, and those four politicians. It wasn’t anyone’s fault aside from the guy who started the fire. For another thing, most of the blame for slow response fell on the U.S. Forest Service. In fact, there was a congressional investigation (Pringle, 2010).
Yet, it is definitely important to remember that all of real-life politics involves geography, because politicians and political boundaries, etc, are all connected to physical places. And when physical disasters like fires occur, there are bound to be political, not just environmental and physical, repercussions. This first map is just the reference map of LA county, the district borders, and the fire spread. In order from earliest to latest fire spread, it goes: red, yellow, blue, purple, pink. As you can see the fire expanded very rapidly.
this next picture is a close up of an extracted layer: just the first fire spread and the districts it affects.
This is stage 2 and the district it affects:
Stage 3:
Stage 4:
And stage 5:
Sources:
"2010 Russian Wildfires." Wikipedia, the Free Encyclopedia. Web. 27 Nov. 2010. <http://en.wikipedia.org/wiki/2010_Russian_wildfires>.
"California in the 111th Congress (2nd Session)." Contacting the Congress. Juan Cabanela. Web. 27 Nov. 2010. <http://www.contactingthecongress.org/cgi-bin/newseek.cgi?site=ctc&state=ca>.
“InciWeb the Incident Information System: Station Fire News Release." InciWeb the Incident Information System: Current Incidents. 26 Sept. 2009. Web. 27 Nov. 2010. <http://inciweb.org/incident/article/9640/>.
McIntire, Nathan. "Names of Firefighters Killed in LA Station Fire Added to Memorial Wall." Fire News, Products, Training, Jobs for Firefighters - FireRescue1. The Pasadena Star - News, 6 May 2010. Web. 27 Nov. 2010. http://www.firerescue1.com/fire-products/firefighter-memorials/articles/816235-Names-of-firefighters-killed-in-LA-Station-Fire-added-to-memorial-wall/
Pringle, Paul. "Federal Inspector General Launches Probe of Station Fire - Los Angeles Times." Featured Articles From The Los Angeles Times. LA Times, 04 Aug. 2010. Web. 27 Nov. 2010. <http://articles.latimes.com/2010/aug/04/local/la-me-station-fire-20100804>.


No comments:
Post a Comment